About the Project
This project was developed as part of a collaboration with Orange and focuses on monitoring and analyzing email transmission data for clients who registered email domains through the company.
The goal was to create a centralized, user-friendly platform that provides real-time visibility into email flow, simplifies log analysis, and helps administrators ensure high deliverability and service reliability.
Homepage
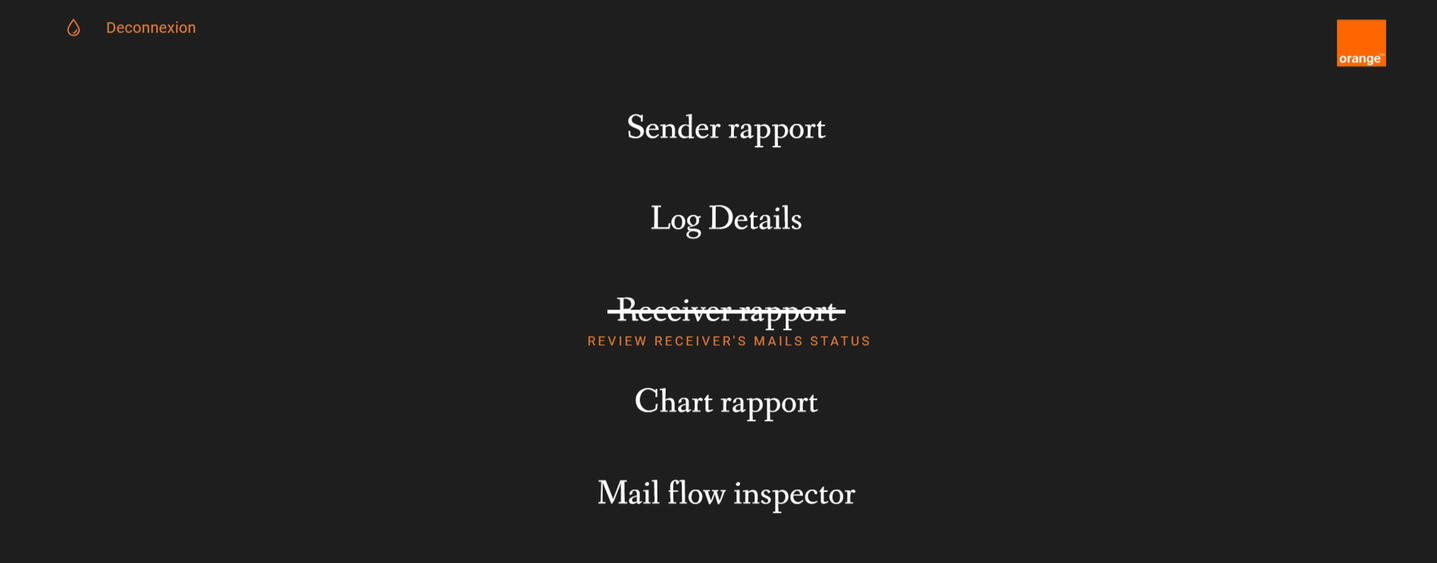
This figure shows the homepage of the platform.
It provides a clean and intuitive interface that allows users to quickly access key sections of the application, such as log search, client reports, and statistics dashboards.
Sender rapport page
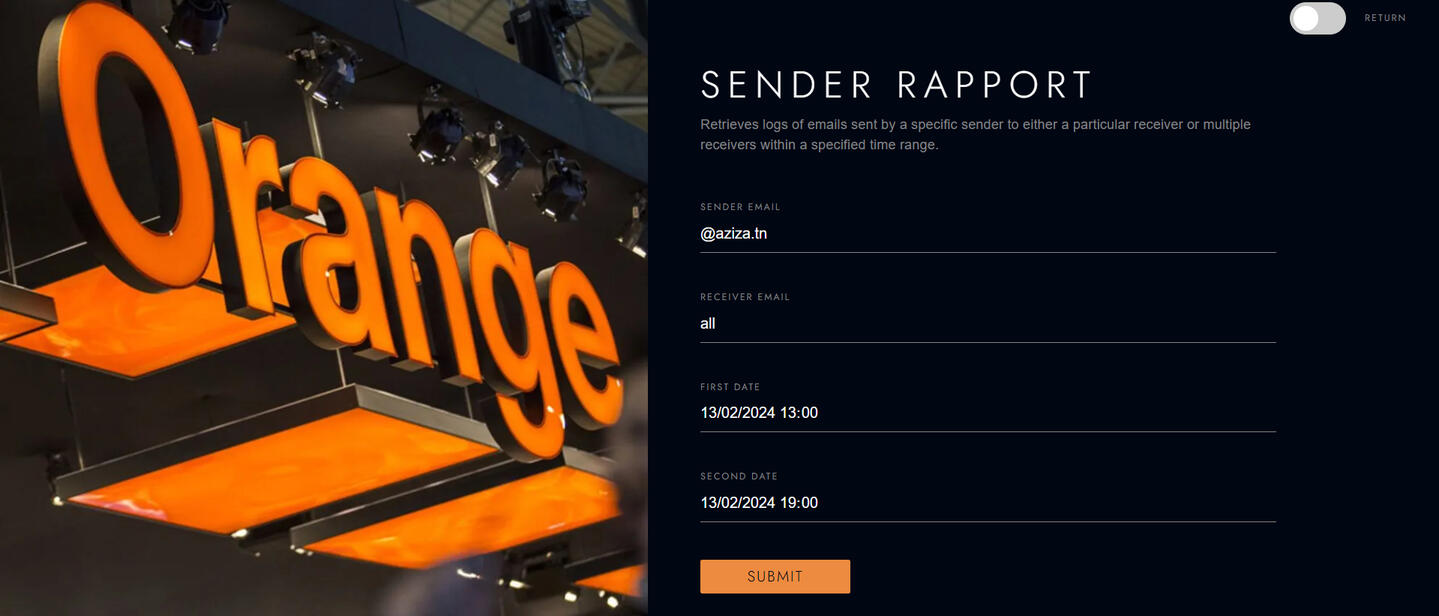
This interface allows users to view email transmissions based on the sender within a specific time range.
Users can either enter the full sender email address or specify a domain (e.g., @orange.tn) in the input field.For the recipient, they can provide the full email address, specify a domain, or simply enter "all" to include all recipients.
Users can also define a date range by selecting a start and end date to filter email transmissions accordingly.
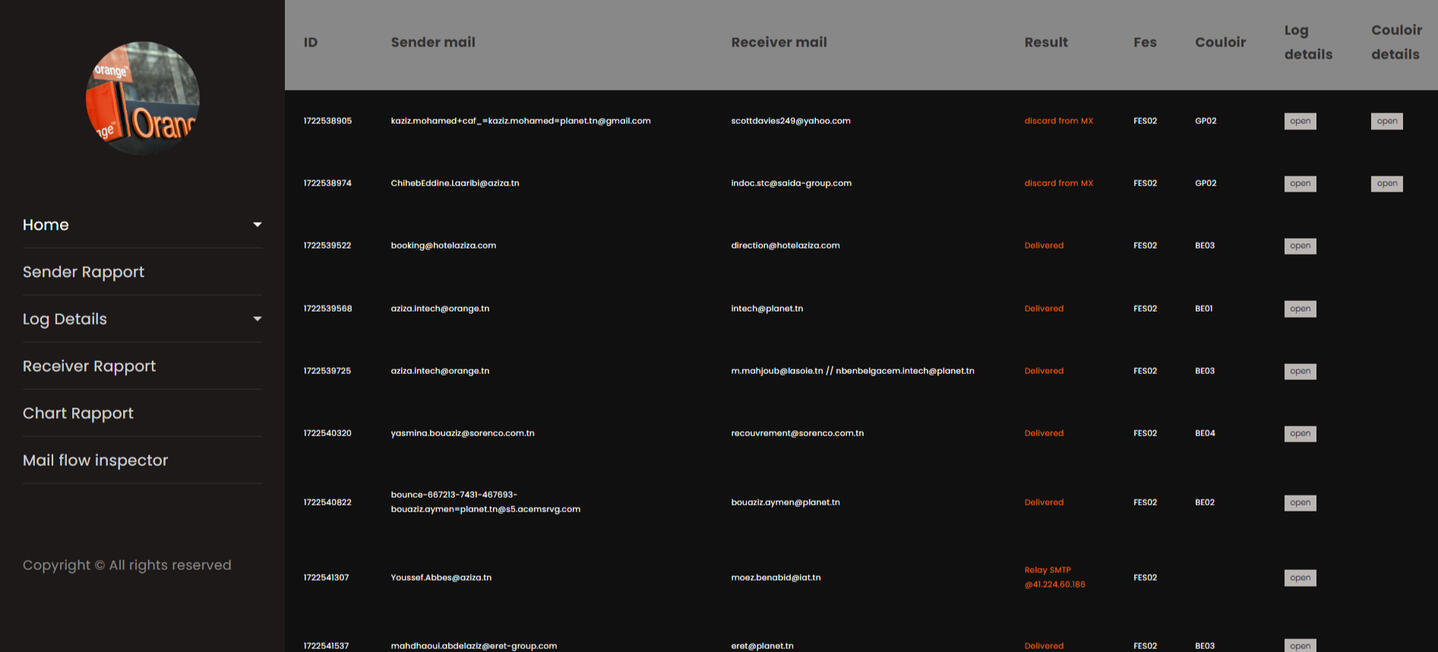
The results will be displayed in a table, as shown in this figure.
This table lists the details of each email, including the ID, sender address, recipient address, delivery status (Result), environment (FES), and transmission channel (Couloir).The status of each email is clearly indicated, such as Delivered or Discarded.
The Open button allows users to view detailed logs for each message.
The interface also includes a sidebar navigation menu that provides quick access to the different sections of the platform.
Chart rapport
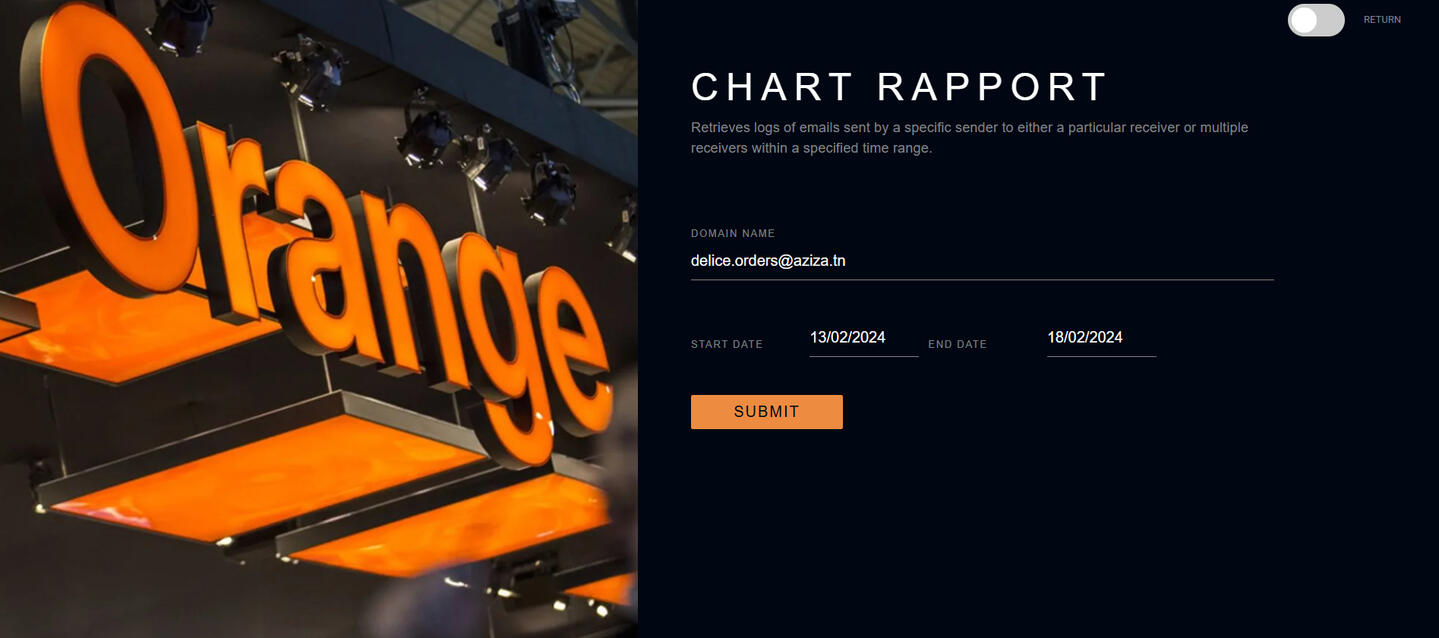
This page is dedicated to generating and displaying detailed email transmission statistics. It provides users with interactive visualizations, such as pie charts and tables, to better understand the distribution of email statuses across a specific domain or time period.
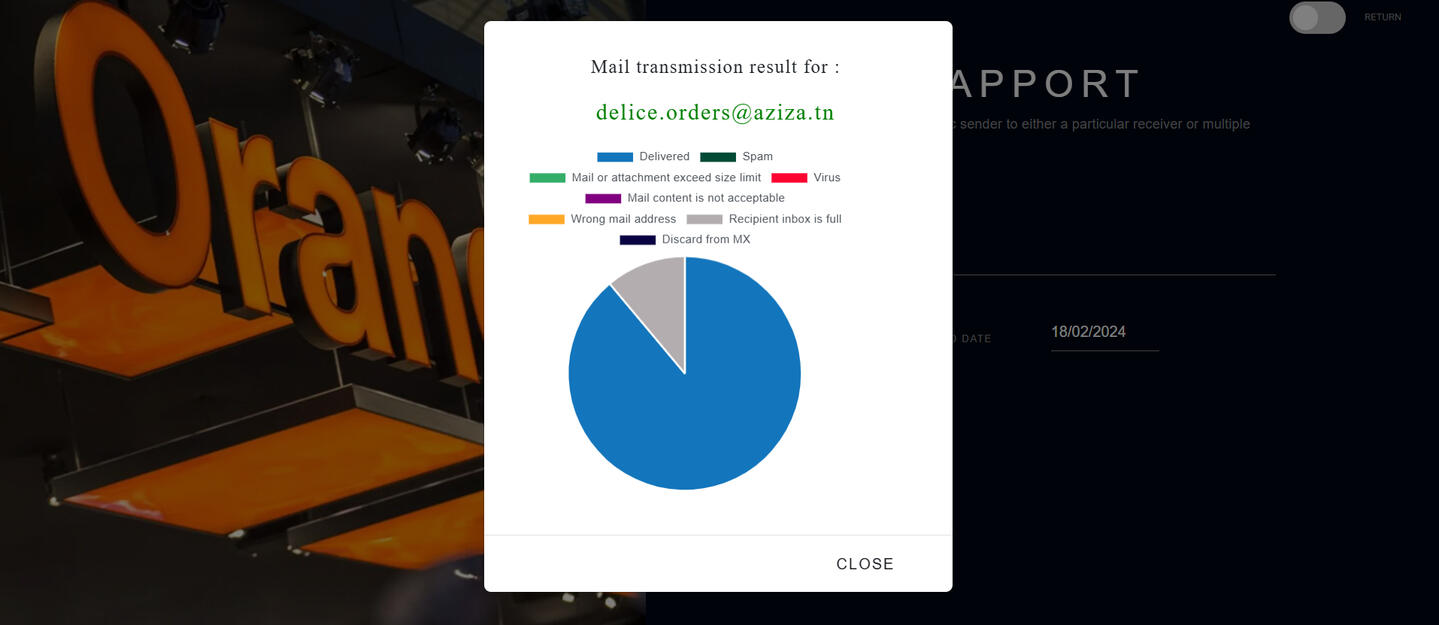
The pie chart offers a comprehensive overview of the distribution of various email statuses such as Delivered, Rejected due to spam, Invalid email address, Unacceptable content, and more.
This visual representation enables users to quickly evaluate the overall performance of email transmissions for a given domain or within a selected date range.
Daily and Alert Reports via email
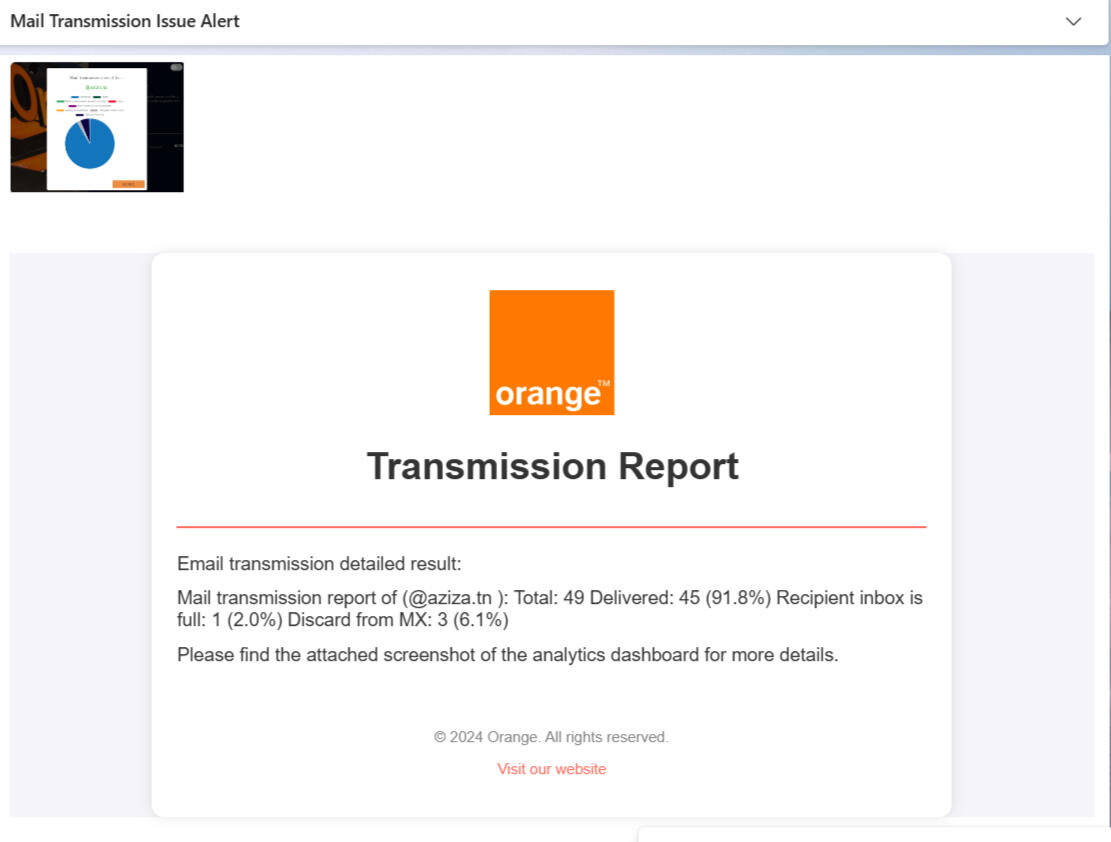
This figure illustrates an example of an email report showing the transmission success percentage along with detailed statistics of these transmissions.
The report is sent in two cases: to clients who are designated to receive daily reports, sent every day at a predefined time, or when a client’s email delivery success rate falls below a threshold configured by the administrator.
Administrator Dashboard
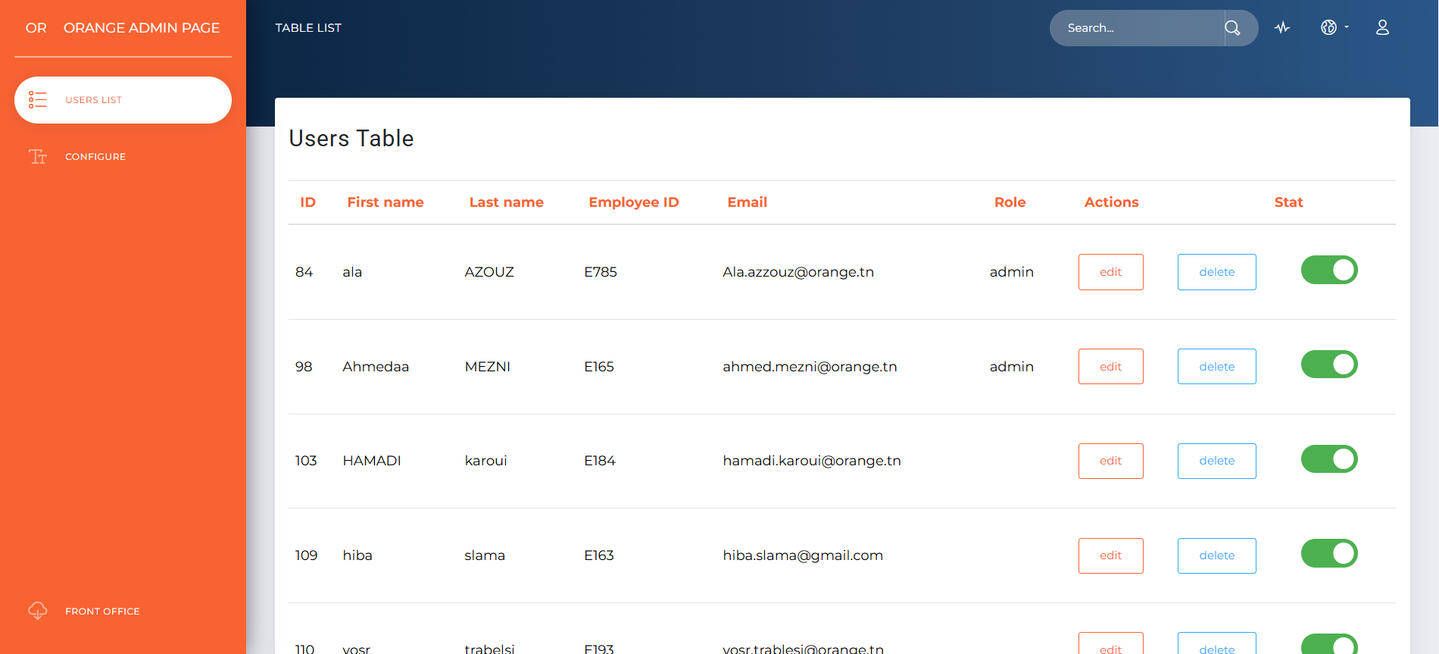
I also implemented an admin page that allows the administrator to manage application users and configure key system parameters.
DevOps Contribution
To ensure the reliability, scalability, and maintainability of the platform, I implemented several DevOps practices throughout the project.
This included setting up automated CI/CD pipelines, containerizing the application, and integrating monitoring tools to enable real-time visibility and proactive issue detection.These efforts helped streamline development workflows, reduce manual intervention during deployment, and improve overall system performance and observability
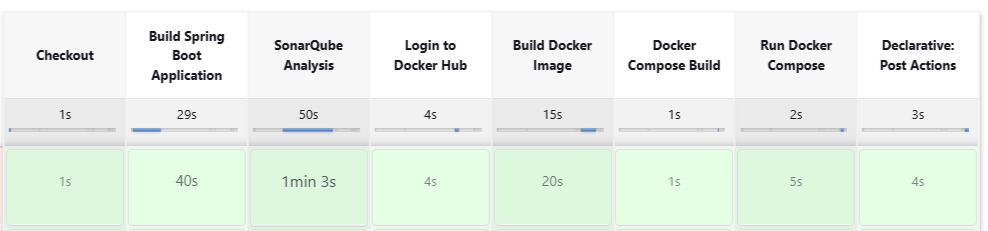
As part of the DevOps implementation, I designed and set up a complete CI/CD pipeline to automate the build, test, and deployment processes of the application.
This pipeline integrates several key features that ensure code quality, streamline delivery, and enhance overall system reliability.
SonarQube Analysis
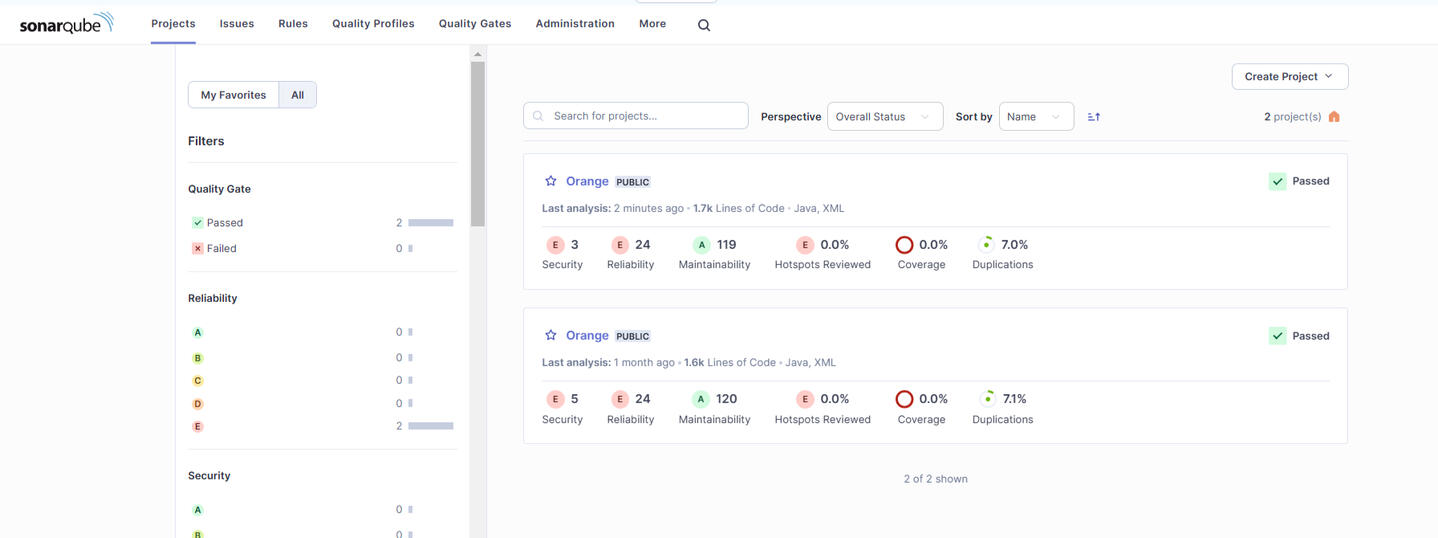
To ensure code quality and maintainability, I integrated SonarQube into the CI/CD pipeline.
This allows the application to be automatically scanned for bugs, vulnerabilities, code smells, and duplicated code with every new commit.
By enforcing quality gates, SonarQube helps maintain clean, reliable, and secure code throughout the development lifecycle.
Trivy vulnerability scanning
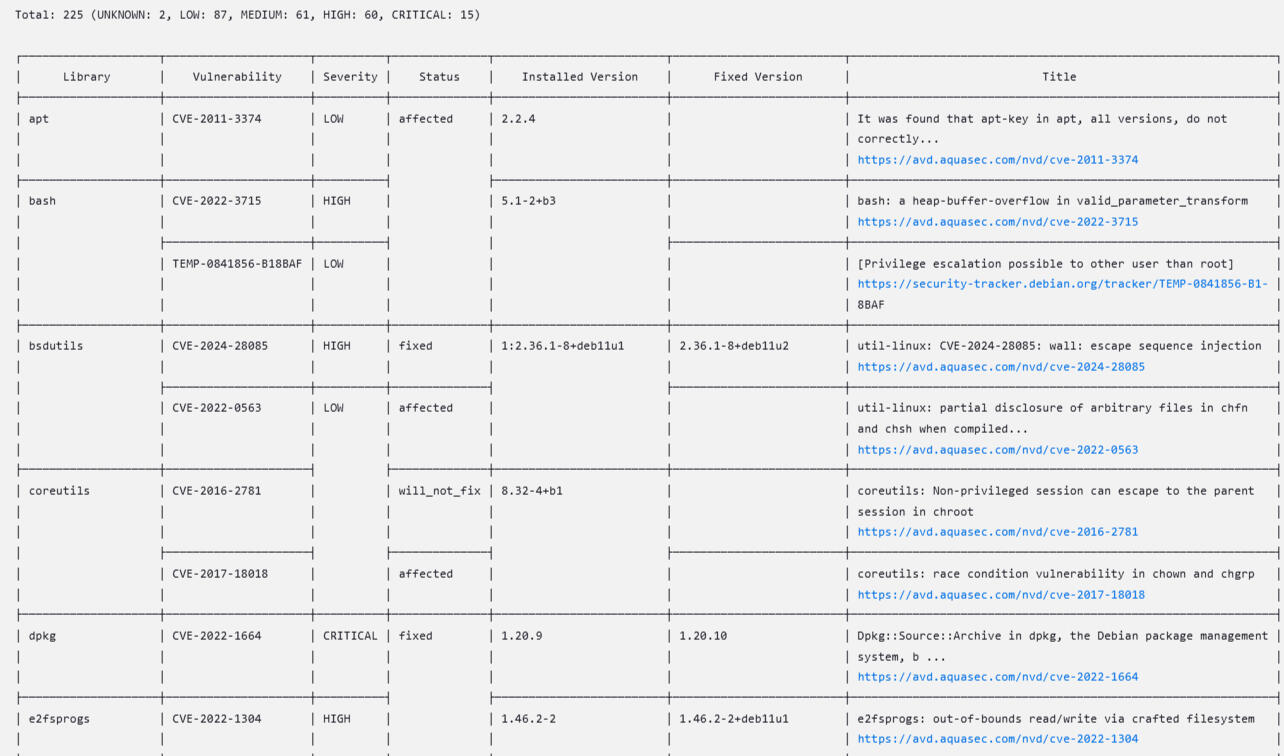
As part of the security measures in the DevOps workflow, I integrated Trivy to perform automated vulnerability scans on Docker images.
Trivy detects known security issues in operating system packages and application dependencies, helping to identify and fix critical vulnerabilities early in the deployment process.
This ensures that only secure, trusted images are built and deployed to the production environment.
Grafana Dashboard
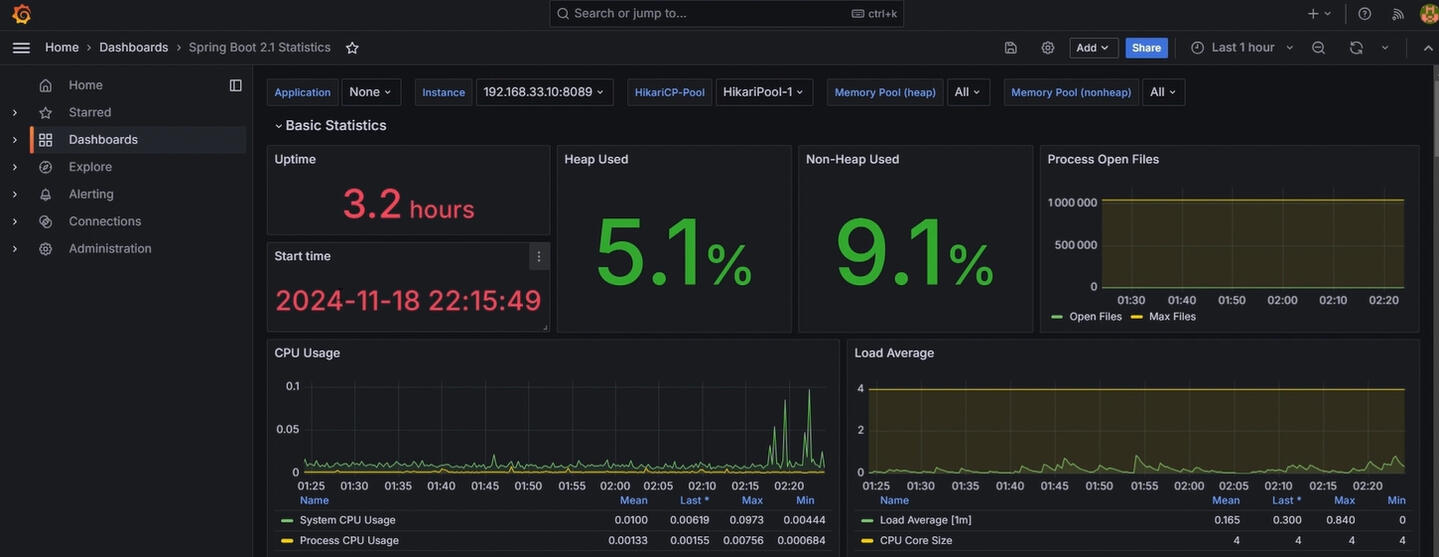
To enhance observability and monitor system performance in real time, I integrated Grafana with Prometheus to create a comprehensive monitoring dashboard.
The Grafana dashboard provides a visual representation of key metrics, helping administrators track the health and behavior of the application and infrastructure at a glance.
Summary & Feedback Invitation
This project involved developing a web-based platform for Orange’s internal email infrastructure to monitor and analyze email transmissions for clients who obtained their email domains through Orange. The platform enables users to search transmission logs by domain or recipient, visualize key statistics via interactive charts, and receive real-time alerts when delivery success rates fall below predefined thresholds. It also includes an admin interface for managing users and configuring system parameters. By integrating modern DevOps practices like CI/CD pipelines, automated testing, and monitoring with tools such as Jenkins, SonarQube, Prometheus, and Grafana, the project ensures a reliable, scalable, and maintainable solution that enhances email deliverability monitoring and client satisfaction.
I welcome any suggestions or feedback to help improve this project please feel free to reach out via the contact links provided.